Introduction
When successfully running a query using the query editor, you will be presented with a view of results, broken down in 4 sections:
- Summary: Displays the raw output of your query as would be available on the Gremlin Console, and, where available, a prettified version of any JSON output.
- Results: Displays the query's results as a hierarchical view that can be filtered and navigated easily.
- Graph (Optional): If your query outputs at least one Vertex or Edge being returned, the Graph View will be displayed, allowing you to visualize your query output as a graph
- Graph (Legacy) (Optional): Same as the above view, the Legacy Graph View has lower performance but slightly more advanced node display options, and will be eventually decommissioned.
- Vertices (Optional): If your query outputs at least one Vertex, the Vertex View will be displayed, allowing to see a table display of returned vertices.
- Edges (Optional): If your query outputs at least one Edge, the Edge View will be displayed, allowing to see a table display of returned edges.
- Query Profile (Optional): If supported by your graph database, this tab will display the .profile() step's output for your current query (or Profile API output for Amazon Neptune)
- Traversal Explanation (Optional): If supported by your graph database, this tab will display the .explain() step's output for your current query (or Explain API output for Amazon Neptune)
Summary View
Gremlin Console Output
The Gremlin Console Output is always available and simply displays the result of your query as would be displayed by the Gremlin Console.
TIP
You can perform a text/regex search on the Gremlin Console Output by pressing Alt-F, Ctrl-F or Cmd-F (macOS)
JSON Formatted Output
The JSON formatted output will display a slightly altered output for your query to allow viewing your elements in more details. Different Gremlin technologies return elements (Vertex, Property, Edge) in different ways, but G.V() will always ensure that a query returning any element includes all its data (id, label, properties).
TIP
You can perform a text/regex search on the JSON Formatted Output by pressing Alt-F, Ctrl-F or Cmd-F (macOS)
Amazon Neptune Slow Query Logs View
Amazon Neptune Engine Version 1.2.1.0 and above only.
If your Amazon Neptune Database has Slow Query logs enabled and the query you've run took longer than the slow query log threshold value, you will be given the option to load the slow query logs produced by Amazon Neptune to investigate the issue further.
Note that your device needs to be configured to use the AWS CLI and be logged in as an IAM user that has the logs:FilterLogEvents permission against your Amazon Neptune slow query logs resource. If your connection is configured to use IAM credentials, Slow Query Logs will be fetched using these credentials. Otherwise, the default AWS CLI profile will be used to load your Slow Query Logs. If your IAM user does not have adequate permission, an error message detailing the permission issue will be displayed.
Additionally, you may be prompted to specify your Amazon Neptune instance cluster name when first loading slow query logs. For more information on Slow Query Logs, please refer to Amazon Neptune's official documentation.
Amazon Neptune Audit Logs View
You can view your database's audit logs on G.V() to quickly and conveniently investigate Gremlin queries run against your database, re-run them, profile them and explain them. You will need to have the neptune_enable_audit_log parameter set to "1" on your Amazon Neptune database to use this feature, though it should be enabled by default.
Note that your device needs to be configured to use the AWS CLI and be logged in as an IAM user that has the logs:FilterLogEvents permission against your Amazon Neptune audit logs resource. If your connection is configured to use IAM credentials, AuditLogs will be fetched using these credentials. Otherwise, the default AWS CLI profile will be used to load your Audit Logs. If your IAM user does not have adequate permission, an error message detailing the permission issue will be displayed.
Additionally, you may be prompted to specify your Amazon Neptune instance cluster name when first loading audit logs. For more information on Audit Logs, please refer to Amazon Neptune's official documentation.
Graph View
Navigating the Graph
Whilst on the graph window, you can perform the following actions:
- Zoom In: To zoom in on the graph, mouse wheel up or press Ctrl-PLUS.
- Zoom Out: To zoom out on the graph, mouse wheel down or press CTRL-HYPHEN.
- Pan Graph: To pan the graph, click on the background of the graph and drag your mouse in the direction you want to pan the graph towards
- Drag Vertices: To drag a vertex, hold left click on it and move your mouse. To drop it, release left click.
- Select Single Edge/Vertex: To select an element, simply left click on it.
- Select Multiple Edges/Vertices: To select multiple elements, left click on each element whilst holding the Ctrl key.
- Box Select Elements: To box select elements, hold the Shift key and hold left click on the background of the graph, then drag your mouse to draw a box. Elements within the box will be selected, however note that edges will only be selected if both vertices composing the edge are also contained within the box.
- Draw Edge Between Vertices: To draw an edge between two vertices, right click hold on a source vertex and drag the edge to its target, then release the right click button. You will then be prompted on the sideview to select a label for the edge and specify properties before confirming the edge creation.
- Group Drag Connected Vertices (Graph View Only): To drag a vertex and all its connected vertices, hold the Ctrl Key and left click drag the vertex
- Group Drag Selected Elements (Graph View Only): To drag all selected elements at once, hold the Alt key and left click drag any selected elements to move them all at the same time.
Graph Context Menu
Right-click anywhere on the graph view to bring up the context menu. You will be presented with the following options, depending on which part of the graph you're right clicking on (Vertex, Edge or background):
- Add New Vertex: Triggers the Add New Vertex menu
- Re-run Graph Layout
- Change Layout: Allows selecting a different graph layout to run
- Layout Selected Vertices: Allows selecting a different graph layout to run only for vertices that are actively selected. This option will only display if at least 2 vertices are currently selected.
- Lock Selected Vertices: Locks vertices, making them undraggable and ignored by graph layouts, unless when using Layout Selected Vertices. This option will only display if at least 2 vertices are currently selected.
- Unlock All Vertices: Unlocks all currently locked vertices.
- Delete All Selected Elements: Deletes all selected elements, will only display if there are elements currently selected. User will be prompted to confirm deletion via a popup.
- Export Selected Elements: If any elements are selected, opens a dialog with various export options for the selected elements (Gremlin query, JSON, GraphML, etc)
- Lock/Unlock: Lock/Unlock a vertex, making it undraggable and ignored by graph layouts. Will only show if right-clicking a Vertex on the graph.
- Edit: Triggers the Edit Element menu, will only show if right-clicking a Vertex or Edge on the graph.
- Delete: Triggers the Delete Element menu, will only show if right-clicking a Vertex or Edge on the graph.
- Zoom On Element: Pans the camera to the element.
- Load Edges: Only shows if right-clicking on a Vertex. Displays various options to load the selected Vertex's in and out edges, allowing to specify which label to load.
Searching or filtering the Graph
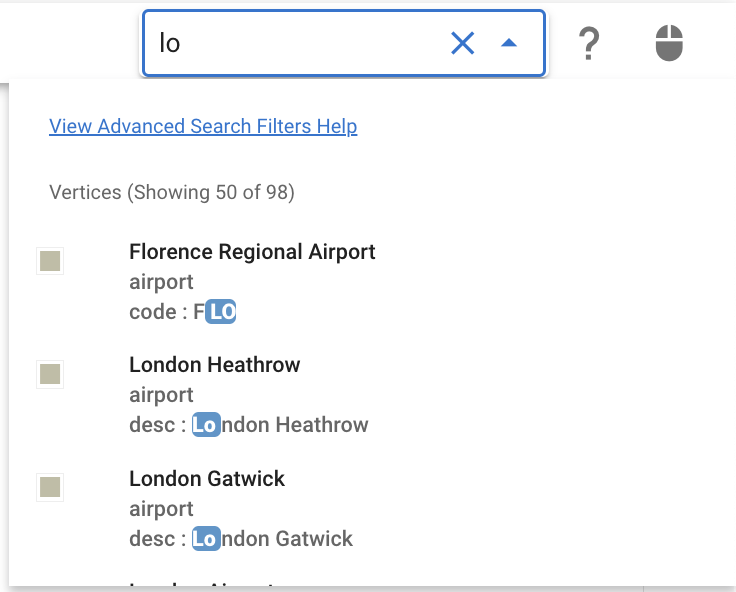
You can filter your graph view via the Search Bar at the top right of the graph view screen. Enter a keyword to start filtering the graph - fuzzy search will be performed by default with results highlighting how your filter was matched to the element, as shown below.
You can also specify advanced filters on your element properties with various string matching options. Advanced filters are specified as JSON objects in the following format:
{ "propertyKeyName" : "StringFilter"}You can combine multiple property filters as follows:
{ "propertyKeyName" : "StringFilter", "propertyKeyName2" : "StringFilter2"}Finally, there are multiple string filters available that you can use and combine to perform advanced string search, such as fuzzy, exact match, starts/ends with, etc. See below a full reference of the available filters:
| Token | Match Type | Description |
|---|---|---|
| jscript | fuzzy-match | Items that fuzzy match jscript |
| =scheme | exact-match | Items that are scheme |
| 'python | include-match | Items that include python |
| !ruby | inverse-exact-match | Items that do not include ruby |
| ^java | prefix-exact-match | Items that start with java |
| !^earlang | inverse-prefix-exact-match | Items that do not start with earlang |
| .js$ | suffix-exact-match | Items that end with .js |
| !.go$ | inverse-suffix-exact-match | Items that do not end with .go |
For example, the filter below will look for all elements in the graph with a code property that starts with 'X' AND a description property that contains the string 'airport'
{ "code" : "^XY", "description" : "'airport"}Interactive Filtering
You can perform more interactive filtering using the Data Filtering Settings in the Graph Sidebar, as shown below:
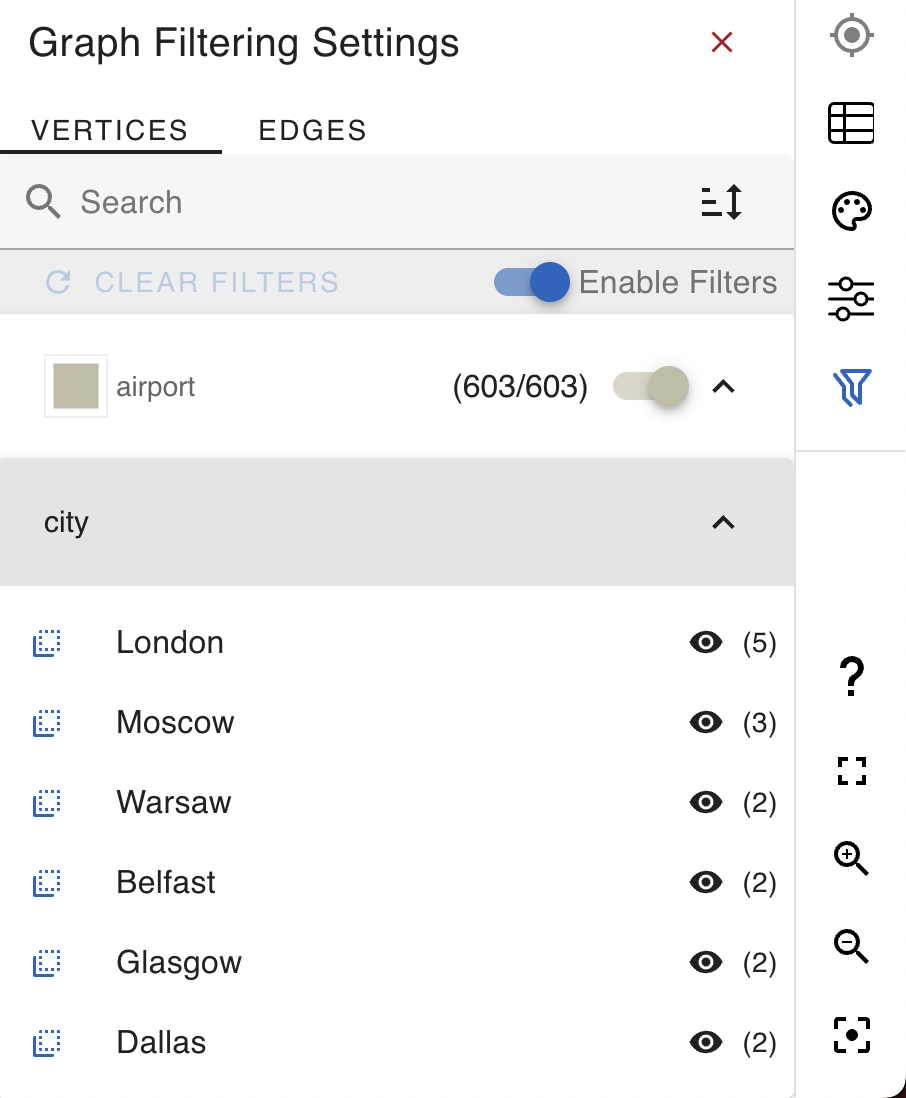
With the Data Filtering View you can select hide or select vertices and edges based on their property values. This view allows quickly excluding elements from the graph view or selecting specific elements in just a click.
Viewing Selected Elements
When selecting one or more element, they will be displayed on a sidebar to the graph allowing you to view the element details. Additionally, further controls to focus on the selected elements will be available on the graph's toolbar.
Navigating Vertex Relationships & Neighboors
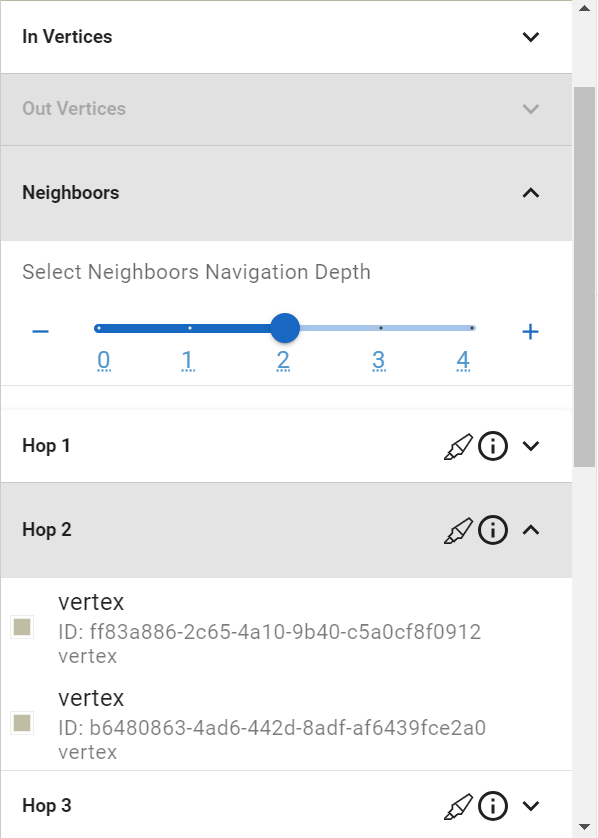
When selecting a vertex on the graph, G.V() will automatically calculate the vertex's neighboors, and its neighboors' neighboors, etc, to build a scale of hops to the rest of the graph. This scale is then displayed under the "Neighboors" tab of the Graph sideview and navigatable in a variety of ways to extract valuable insights from your graph view. This feature is only available on the non-legacy Graph View
Updating Selected elements
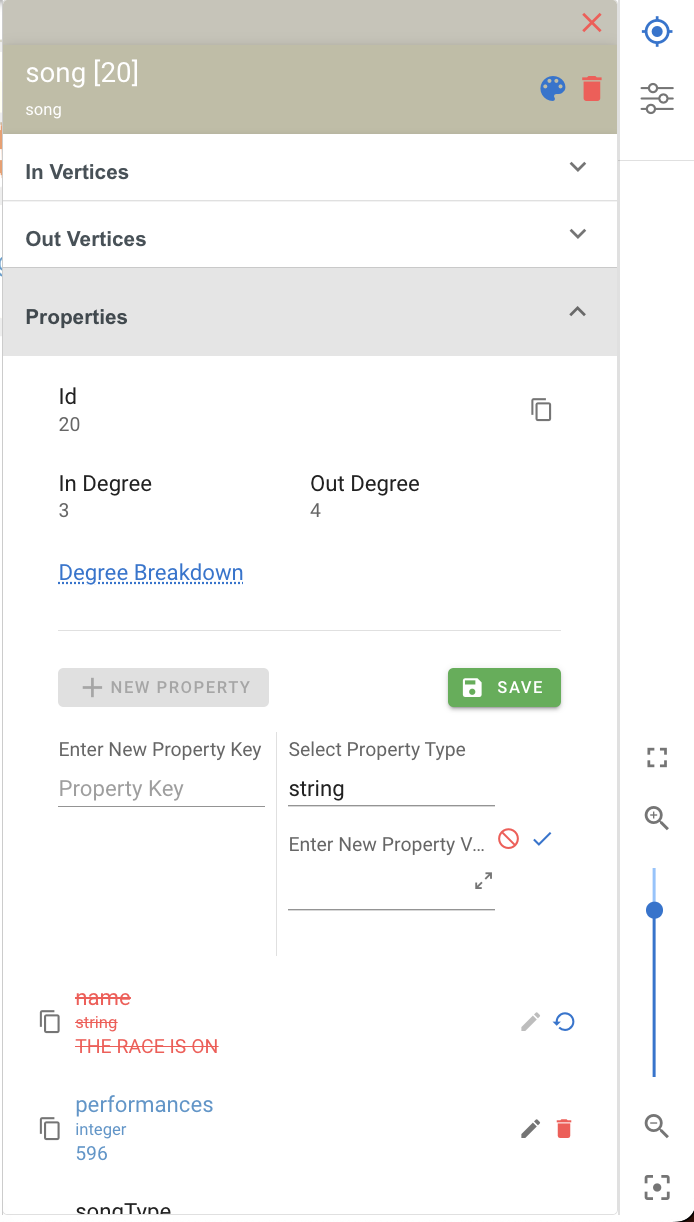
The graph sideview provides WYSIWYG ("What You See Is What You Get") functionality allowing you to perform the following:
- Add missing element properties as observed across other elements of the graph with the same label
- Add new properties to the element
- Update existing element properties
- Remove element properties
- Update styles for elements using the same label on your graph
See example of the view below:
Deleting elements
In the graph sideview, you can delete an element by clicking the icon. You will be prompted to confirm the deletion of the element. Upon confirmation, the element will be deleted.
TIP
When deleting a vertex, all incoming and outcoming edges for that element will also be deleted just the same as dropping the element using a Gremlin query
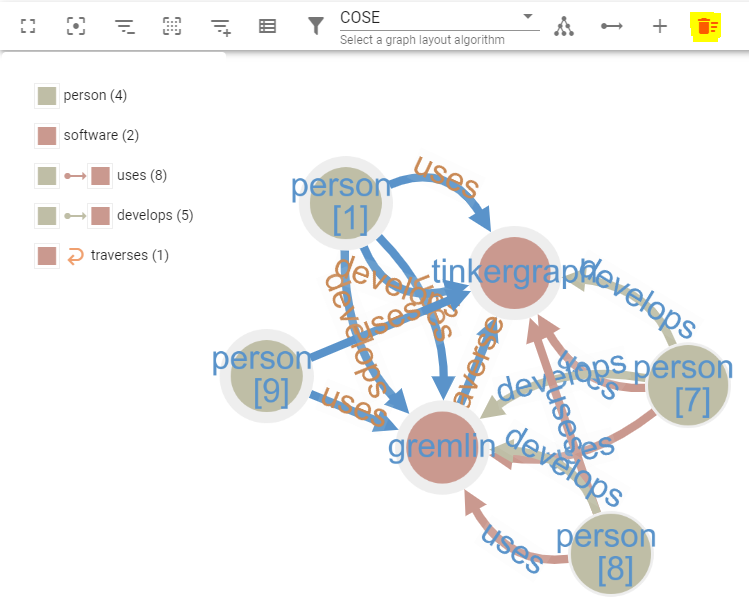
Alternatively, when selecting multiple elements in the Graph View, you will be given the ability to delete all selected elements, as shown below:
Modifying Elements
Your element's properties are listed in a table and can be added/updated/deleted. G.V() will attempt to enforce loose type checks on your properties based on observed values to allow consistency for your value types. Property value types for Edges and Vertices are also enforced based on the features of your graph, which can be consulted at any time using the Graph Features functionality.
Depending on the type of your property, you will be presented with different editor views to facilitate setting values. The following types are currently supported and available to edit in G.V():
- boolean
- boolean array
- integer
- integer array
- long
- long array
- double
- double array
- string
- string array
- float
- float array
- object (an object is treated as a generic type that can be any of the above)
- object array
The following types are not yet supported:
- byte
- byte array
- map
These types apply just the same to Vertex meta-properties.
Vertex meta-properties will only be displayed and available to modify in your graph when jointly enabling the Fetch Vertex Meta Properties option on the associated query editor. When adding a new property to an element, G.V() will attempt to recommend a property key to use based on properties observed on other elements with the same label and whether they exist on the element already. When adding a property to an element that is not existing on any other element for that label, the data model will be automatically reloaded, causing the property key to be suggested for the database connection in query editors, graph sideviews and under the data model explorer.
After all property modifications are complete, you can save the element changes by clicking the icon on the top right of the view.
Graph Toolbar
At the top of the graph is a toolbar with helper functionality available to help you shape the graph to your needs. The following commands are available:
- Detailed Element View
: When toggled, shows full details for each vertices as tables of properties. This feature is only available in the Legacy Graph view.
- Export as PNG
 : Allows you to export the current graph in display as a PNG file. Not available with Detailed View enabled.
 - Filtering
: Allows you to toggle on and off the display on the graph of specific edge or vertex labels.
- Layout: A select list of available layout algorithms to organize your graph. Selecting a different layout algorithm will cause the graph to re-arrange itself according to that algorithm.
- Focus Selected Elements
: If you have one or more vertex selected in the graph, clicking on this icon will re-layout the graph and hide all vertices that aren't direct neighboors of the selected elements.
- Focus Elements Neighboor Level Up
: If you have one or more focused elements in the graph, clicking on this icon will extend the focus to a further level of indirect neighboors for your selected elements.
- Focus Elements Neighboor Level Down
: If you have one or more focused elements in the graph, clicking on this icon will shrink the focus down a level level of indirect neighboors for your selected elements.
- Enable Data Explorer
: Enables Data Explorer mode, allowing you to load data on the graph as you click on vertices. Whilst Data Explorer mode is enabled, clicking on a vertex will cause G.V() to fetch all neighboor vertices from your graph database and output them on the graph.
- Reset to Initial Results
: This option will only display when elements are loaded via Data Explorer mode. Clicking on it will reset your graph view to the initial results as returned by the query you've run.
- Enable Edge Drawing
: Enables edge drawing on the graph. When enabled, left-click hold the node to create the edge from and drag it to the node you want to assign the edge to. Once you release the left click, will be prompted on the sideview to select a label for the edge and specify its properties before confirming the edge creation. .
- Add Vertex
: Adds a Vertex on the graph. You will be prompted on the sideview to select a label for the vertex and specify its properties before confirming the vertex creation.
- Delete Multiple Elements
: When multiple elements are selected on the graph, click on Delete Multiple Elements to delete all selected elements. You will be prompted to confirm deletion beforehand.
- Export Graph Results: Provides various export formats for your currently displayed graph (GraphML, JSON, CSV, GEXF, Gremlin Query)
- Search Graph...: Allows filtering elements already displayed on the graph by specifying a search value. The search value is evaluated against the id, label and property values of all elements on the graph to allow quickly finding a specific element.
Graph Sidebar
At the right side of the graph is a toolbar to allow manipulating graph navigation. The following commands are available:
- Fullscreen
: Toggles fullscreen display for the graph view
- Reset Graph Position
: Resets the graph's panning and zooming to default
- Zoom In:
: Zooms Into the Graph
- Zoom Out:
: Zooms Out of the Graph
- Labels Display Threshold: (non-legacy Graph View Only) Specifies the Vertex size threshold at which its label should display
- Graph Size Settings: Allows specifying rules to determine the size of elements displayed on the graph based on property values and other metadata.
- Data Table View: Allows viewing elements displayed in the graph in a table format as described respectively in Vertex View and Edge View.
- View Selected Items: Only available when elements are in focus. Displays details for the selected elements and allows editing them.
Graph Size Settings
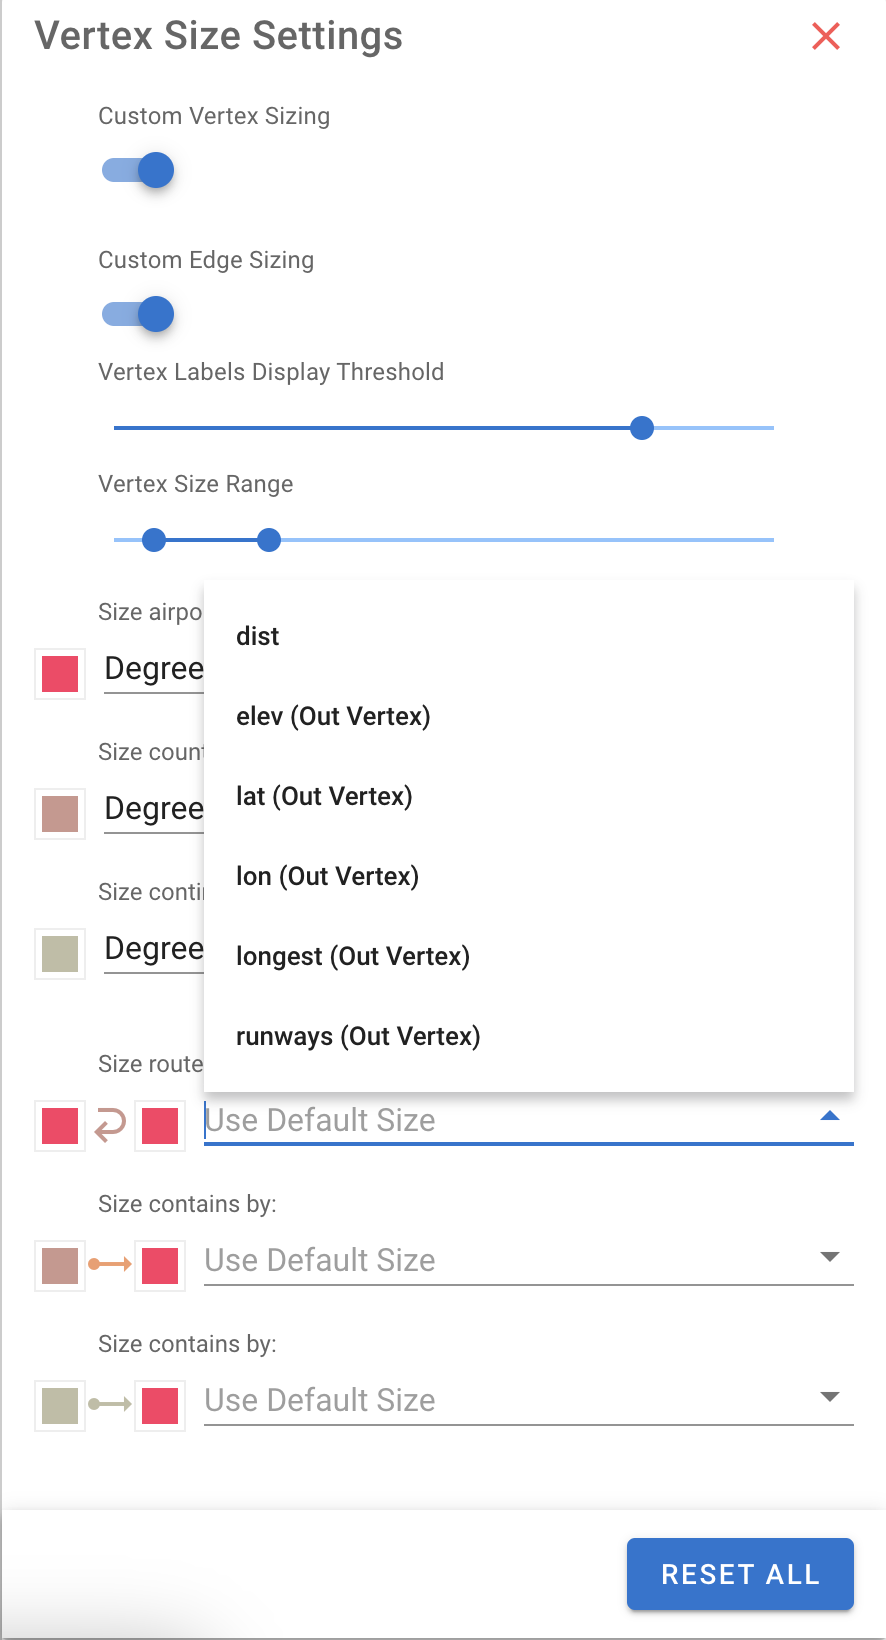
In the Graph Size Settings view, you can specify rules to determine the size of elements displayed on the graph based on property values and other metadata. The property values that can be used must be numeric and will be automatically listed for each element currently displaying on the graph.
Additionally, on the Graph View, you can specify a Label Display Threshold which determines how a vertex on the graph needs to be for its label to be displayed.
Edges can be sized according to their numeric properties as well as numeric properties of their incident vertices.
You can also specify a Minimum/Maximum Vertex size to influence the overall sizing of elements on the graph.
You can save those settings directly against your stylesheet so that they can be re-used on all your graph visualizations.
WARNING
Sizing Rules for vertex and edge labels cannot currently be saved against a stylesheet but this feature will be available in the near future.
Graph Styles
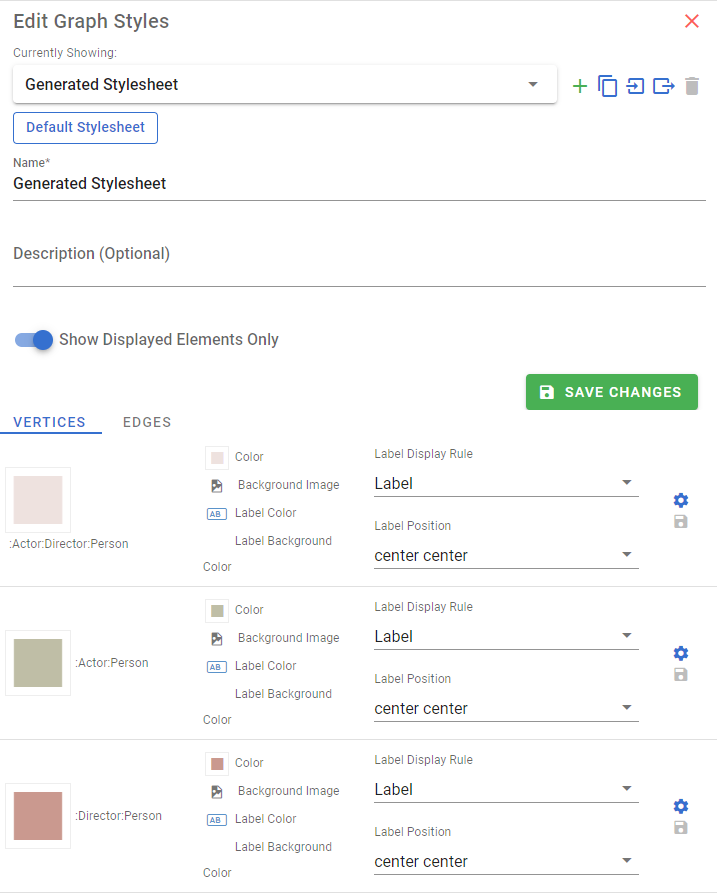
In the Graph Styles view, you can quickly set the styles of your vertices/edges on the graph as well as switch between different stylesheets. The Graph Styles view will allow you to set styles for vertices and edges as discovered during the data modeling process and as found on your currently displayed graph. For more details on stylesheet management, refer to Stylesheet Management
TIP
You can import/export your stylesheets and share them with other members of your team!
Graph Legend
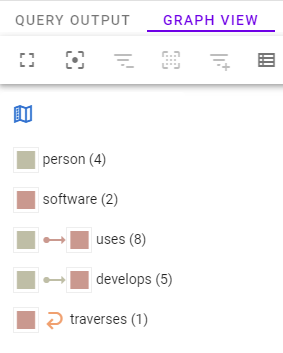
The Graph Legend displays a summary of the elements available on your graph and their appearance. You can toggle elements on the graph legend to show or hide. You can also hide or show the graph legend by clicking . Below is an example of the Graph Legend:
Vertices View
The Vertices View allows you to see any vertices returned by your query in table form. There are two different types of displays:
- Aggregate Vertex View: Displays all vertices returned grouped by label. In this display, properties are displayed in JSON form, with the option to see the properties displayed as a table for a given vertex by clicking "View Details".
- Label Specific Vertex View: Displays all vertices for a specific label. Properties are displayed individually as columns on the table. When different vertex labels are returned by your query, you will be given the open to select a specific label to see vertices for.
All vertex rows have a "Show On Graph" control () which allows zooming in on the specific vertex directly on the graph view, and a delete button allowing you to delete the element from your graph.
The table can be sorted by columns by clicking on the column name. Additionally, results in the table can be grouped by column by dragging the column name into the blank area above the column headers. Finally, column results can be filtered according to various predicates by clicking on the three vertical dots displaying to the right of the column name.
Edges View
The Edges View allows you to see any vertices returned by your query in table form. There are two different types of displays:
- Aggregate Edge View: Displays all edges returned grouped by label. In this display, properties are displayed in JSON form, with the option to see the properties displayed as a table for a given vertex by clicking "View Details".
- Label Specific Edge View: Displays all edges for a specific label. Properties are displayed individually as columns on the table. When different edge labels are returned by your query, you will be given the open to select a specific label to see edges for.
All edge rows allow you to view the details of the "from" and "to" vertices, as well as show the "from" and "to" vertices on the graph by clicking on , and a delete button allowing you to delete the element from your graph.
The table can be sorted by columns by clicking on the column name. Additionally, results in the table can be grouped by column by dragging the column name into the blank area above the column headers. Finally, column results can be filtered according to various predicates by clicking on the three vertical dots displaying to the right of the column name.